
Canopy cover time series
Canopy cover rose from 29.6% in 1978 to 40.9% in 2020. Most of the gain came between 1978 and 1996 (0.53% a year), driven by forest landscapes and the reforestation of farmland.
Research Products / Open dataset
Open data and code on how tree canopy has changed across the Region of Peel, southern Ontario, from 1944 aerial photographs and tree rings to annual 30 m Landsat canopy cover maps for 1972–2020.
The Region of Peel (Mississauga, Brampton and Caledon) grew from about 32,000 people in 1941 to about 1.5 million in 2020, and its tree canopy changed along with it. This collection brings together the open data and code from the doctoral research of Dr. Mitchell Bonney with Prof. Yuhong He. At its centre is a yearly 30 m tree canopy cover time series for 1972–2020, built from Landsat imagery.
Across the historically treed part of the study area, canopy cover rose from 29.6% in 1978 to 40.9% in 2020. Companion datasets map canopy in residential neighbourhoods since 1972 and in each municipality in 2018, record tree density from aerial photographs taken since 1944, and provide tree-ring measurements from 16 forest stands.
These data can support urban forest management and planning in the Region of Peel and the Credit River Watershed. The canopy maps and time series can be used to track progress toward municipal canopy targets, identify neighbourhoods with less access to tree canopy, evaluate how development, reforestation, tree planting, drought, pests and storms have shaped the canopy, and anticipate how canopy will change as new neighbourhoods age. They also offer municipalities a low-cost way to monitor canopy cover every year with free Landsat imagery.
Canopy cover rose from 29.6% in 1978 to 40.9% in 2020. Most of the gain came between 1978 and 1996 (0.53% a year), driven by forest landscapes and the reforestation of farmland.
After falling by more than 5% in the decade after 1972, residential canopy has stayed at 18–20% in Mississauga and 13–16% in Brampton. It is higher where population density is lower and where fewer residents are members of visible minorities.
Caledon has 34% canopy cover, Mississauga 17.5% and Brampton 15.9%. Against residential canopy criteria, Caledon rates “Good”, Mississauga “Moderate” and Brampton “Low”.
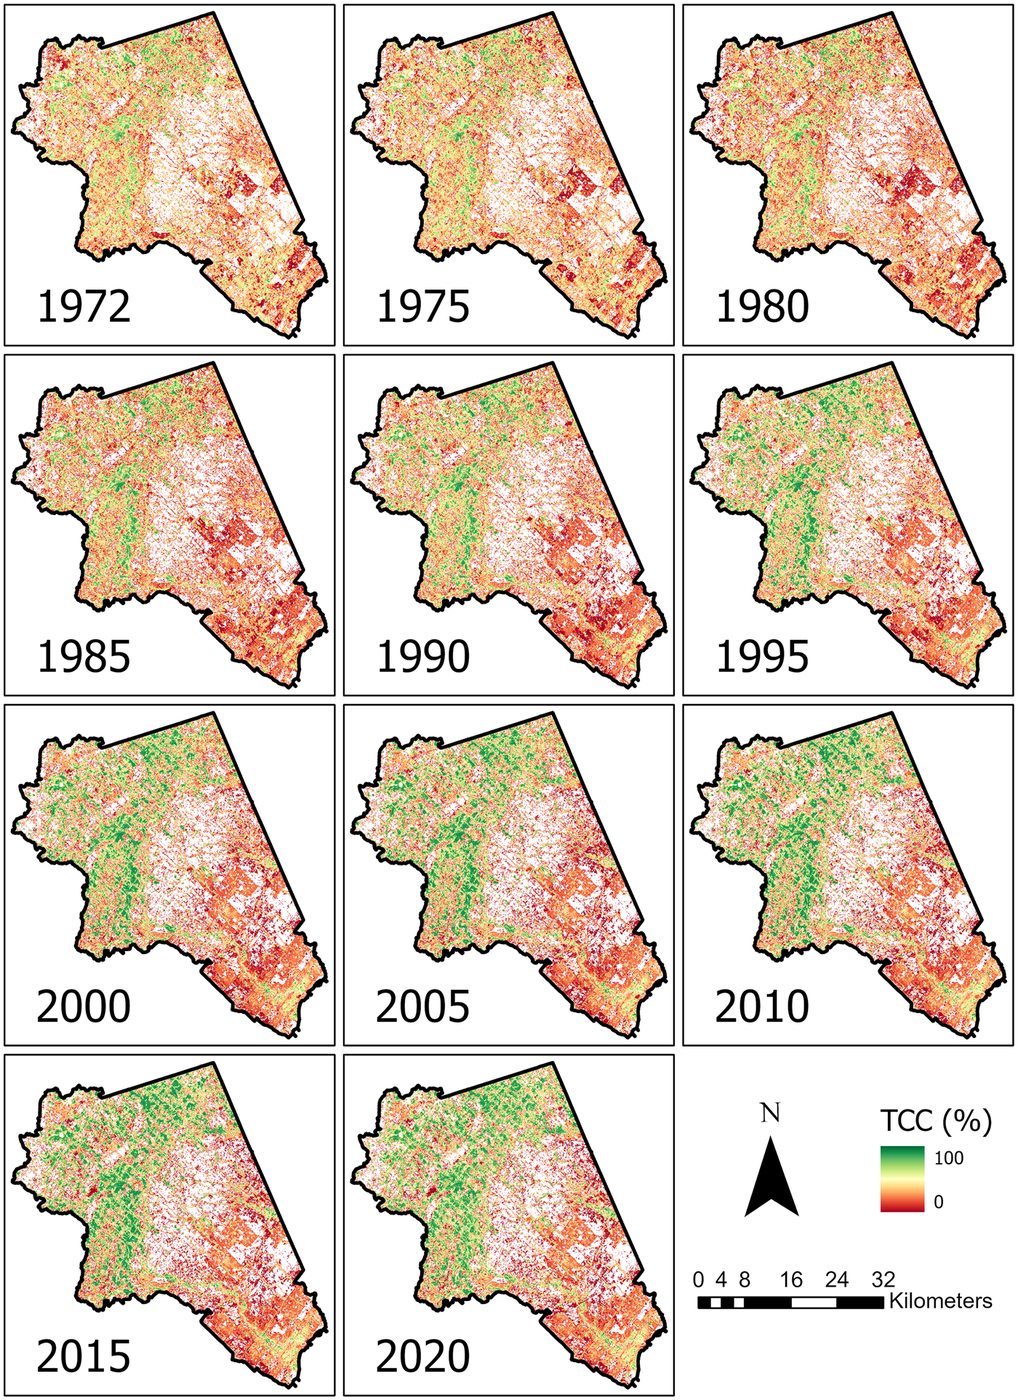
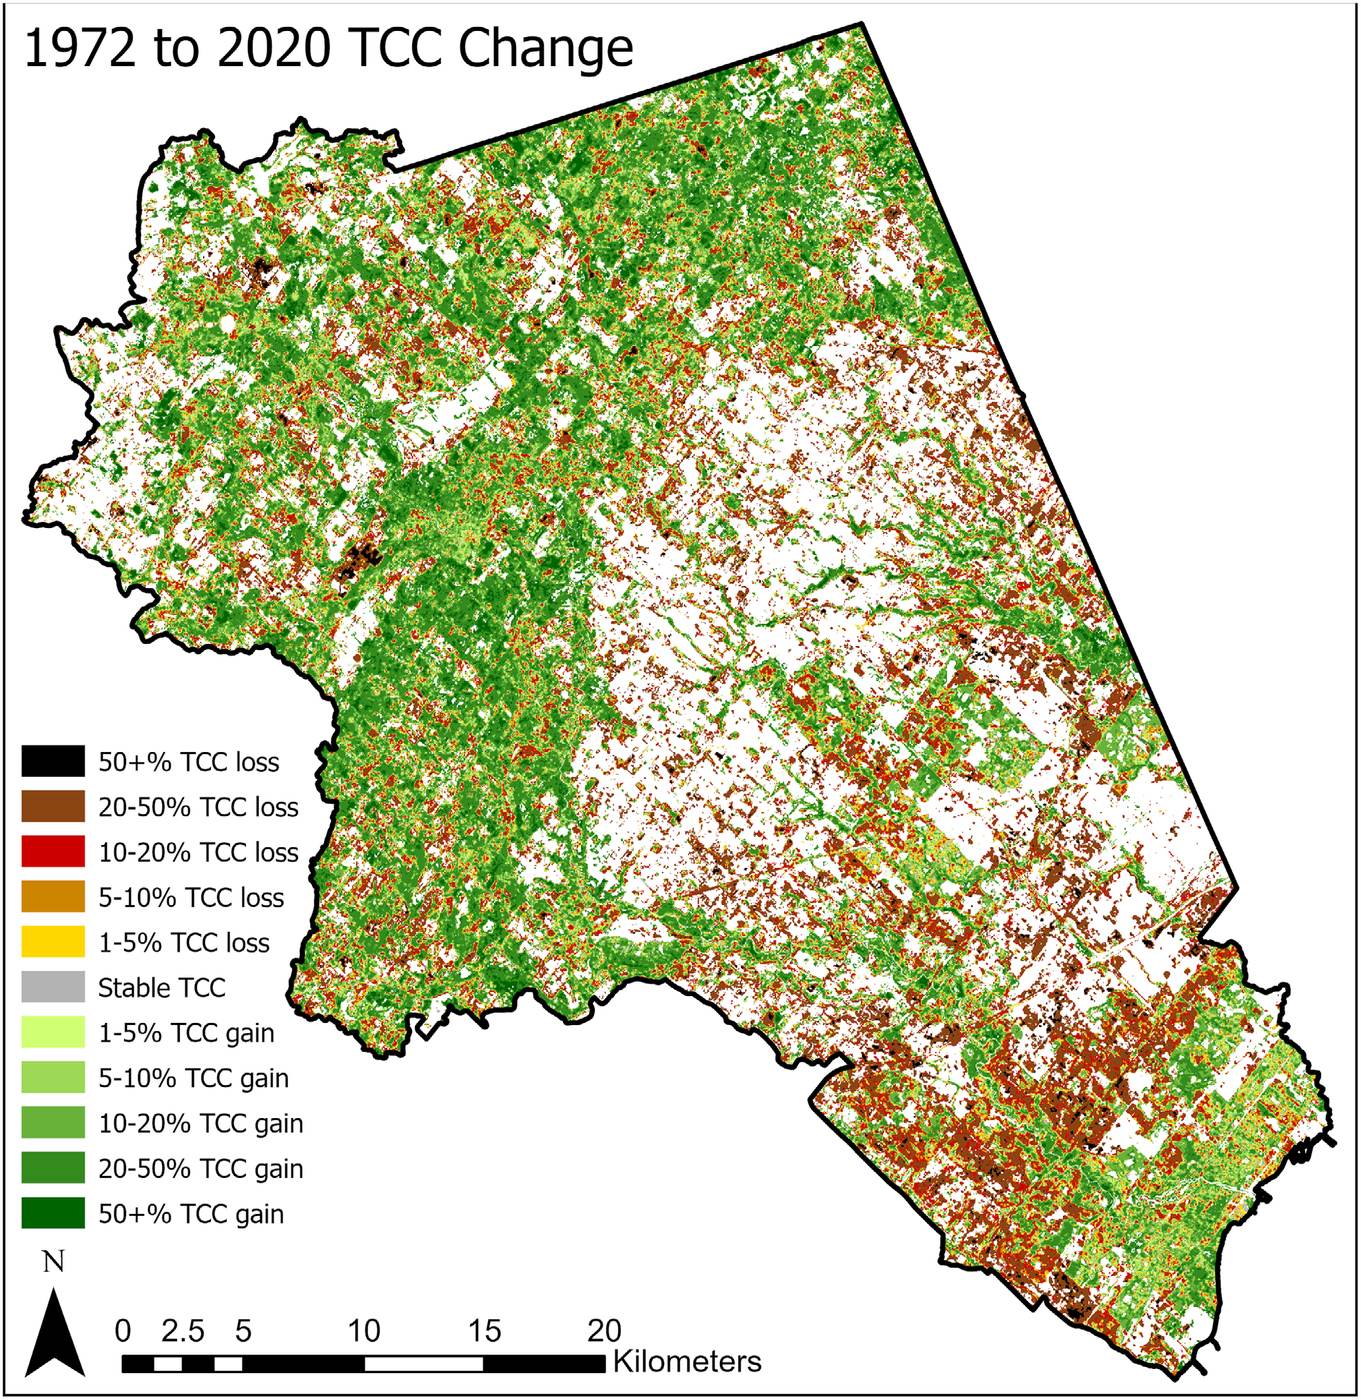
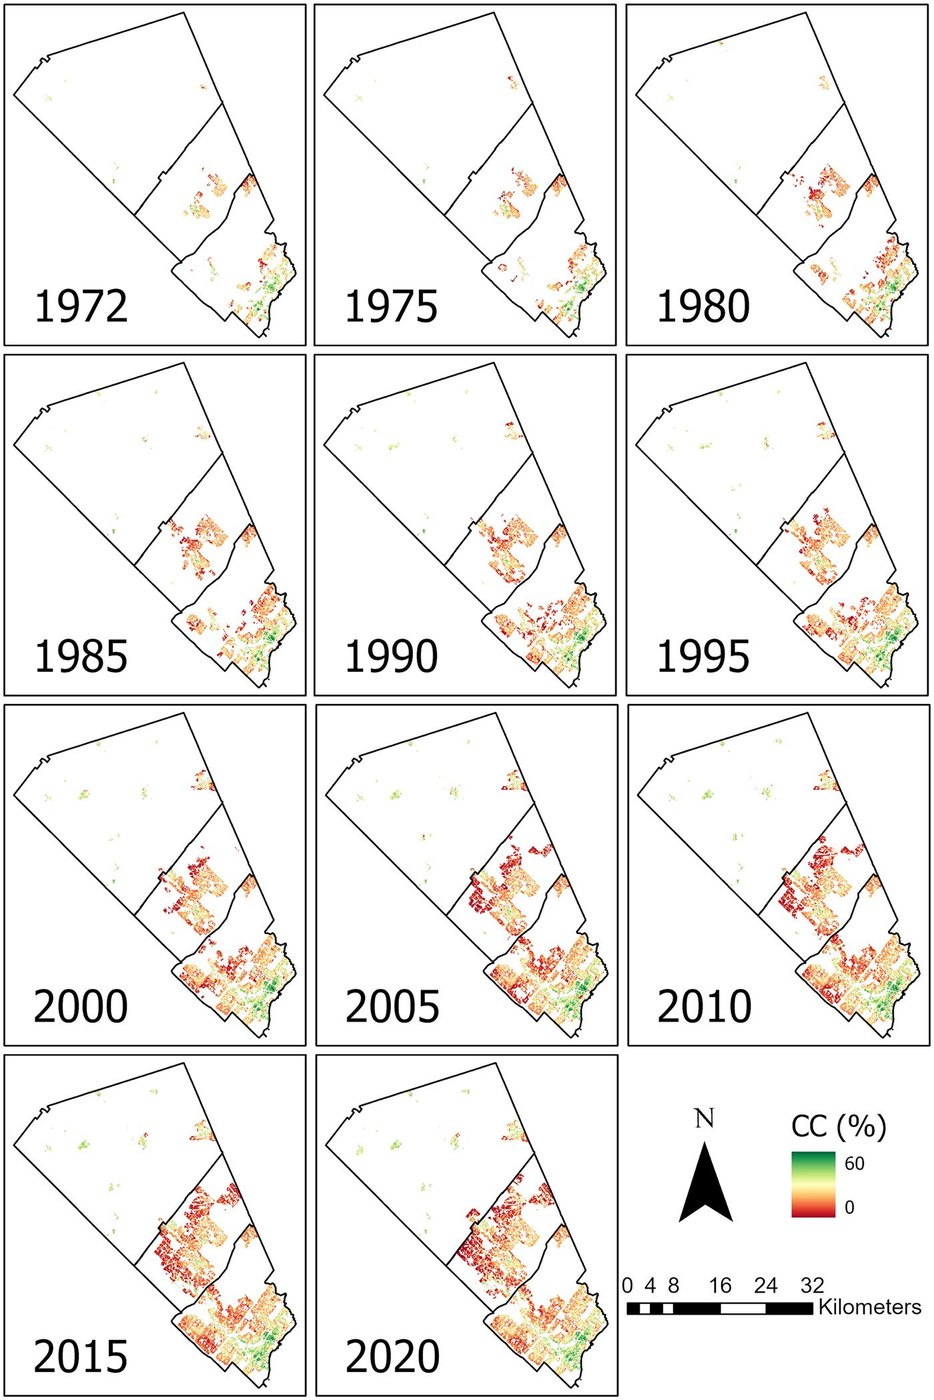
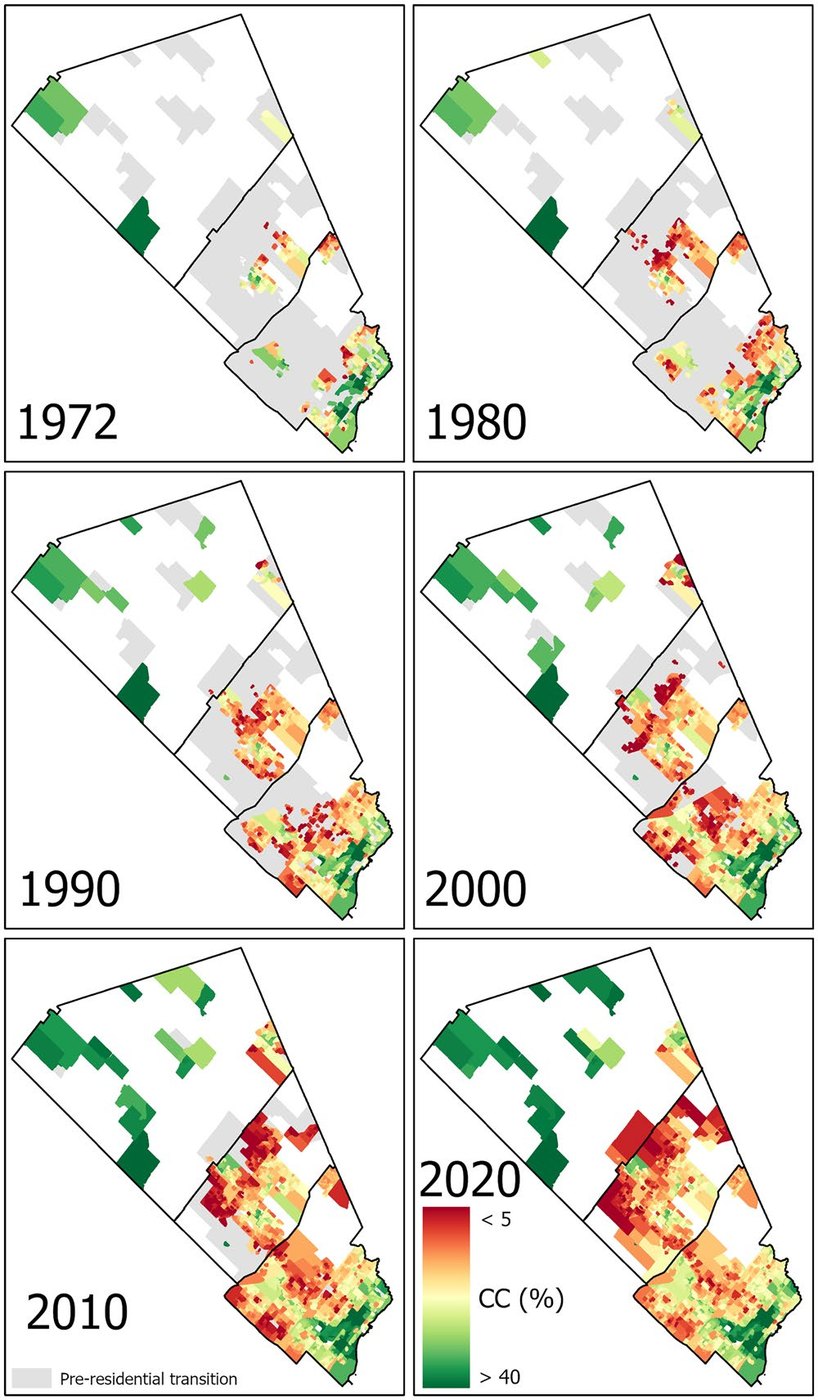
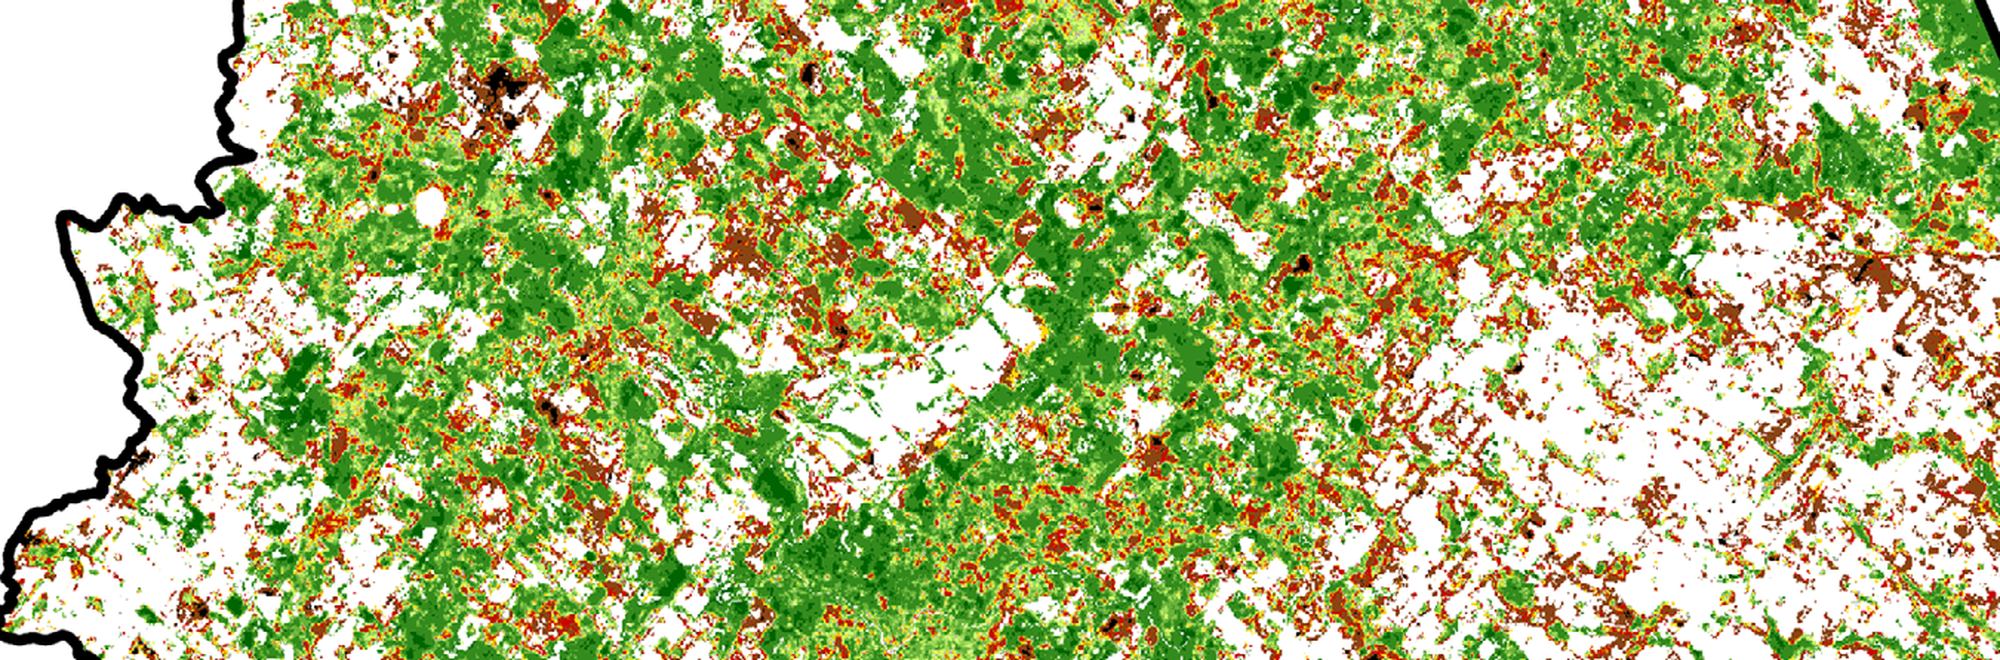
Figures reproduced from Bonney & He (2025) and Bonney & He (2026), Canadian Journal of Remote Sensing, open access under CC BY 4.0. The banner is a crop of Figure 10 of Bonney & He (2025).
Bonney, M. T., & He, Y. (2025). Using Landsat time-series to investigate nearly 50 years of tree canopy cover change across an urban-rural landscape in southern Ontario. Canadian Journal of Remote Sensing, 51(1), 2445836. https://doi.org/10.1080/07038992.2024.2445836
The companion datasets are described in these articles:
Questions about the data, the methods or collaboration on urban forest monitoring are welcome. Please get in touch with the laboratory.
For other enquiries, see the lab contact page.
Principal Investigator, RSSEM Lab
Department of Geography, Geomatics and Environment, University of Toronto Mississauga